
AEB: a Case Study Using comma.ai Dataset
A data driven approach to evaluate driving assistance features
Features, such as Automatic Emergency Braking (AEB), are meant to improve the safety of the vehicle by reducing both the occurrences and the severity of accidents. Unfortunately, they usually have a long development cycle and effectiveness that is difficult to quantify.
A precise estimate of the real-world benefits deriving from a safety feature isn’t easy: car manufacturers and tier 1 suppliers are in charge of the technical development of Driver Assistance Systems (DAS), but other than Tesla, they lack the ability to collect data and feedback from the field. Car manufacturers also lack the ability to issue Over-The-Air (OTA) software updates, which is another strong limitation in developing and deploying new features.
On the other hand, insurance companies, government agencies (e.g., NHTSA) and independent organizations (e.g., IIHS) have large data sets available, but they are not in the position to deploy safety features or propose technical changes. Also, the available data (insurance claims, incident reports etc…) is not sufficiently detailed for in-depth technical analyses.
Thanks to our fleet of EON users, we have collected over 13 million miles of driving data all around the globe. Currently, our users upload over 35,000 miles each day, which is almost three times what an average car drives in the US per year. The data includes full CAN traffic of the car and outputs from the EON sensors, such as videos from the forward facing camera (plus driver’s facing camera, if user opts-in), accelerometer, gyroscope and high precision GPS.
We can scan our large data set in search for driving events of any kind, as long as they are definable through signal patterns of what we collect. The real advantage of such a large data set, though, is the ability to look for events with very low occurrence. Events that happen every 100,000 miles have most likely happened over 100 times in our rapidly growing data set.
Finding rare events: AEB in Honda vehicles equipped with Bosch DAS.
An example of a rare event is the car’s driver assistance system issuing an AEB maneuver in order to prevent or mitigate a collision.
We have already discussed using our data to develop a FCW algorithm for openpilot in 2018. In this post we show a similar approach to evaluate the effectiveness of the stock AEB feature as the starting point to develop our own AEB algorithm for openpilot.
We started by looking into how many AEB events we captured in our fleet. For the sake of this study, we decided to limit the scope of the analysis to Honda vehicles equipped with Bosch DAS system: this represents the majority of the Honda vehicles sold today. This choice filters the number of driven miles that we can use in our analysis to 1.04 million.
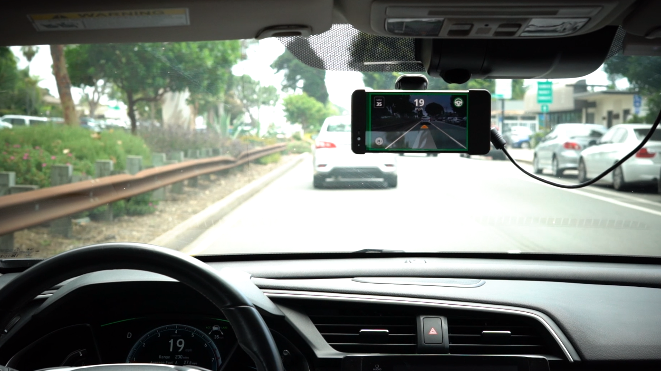
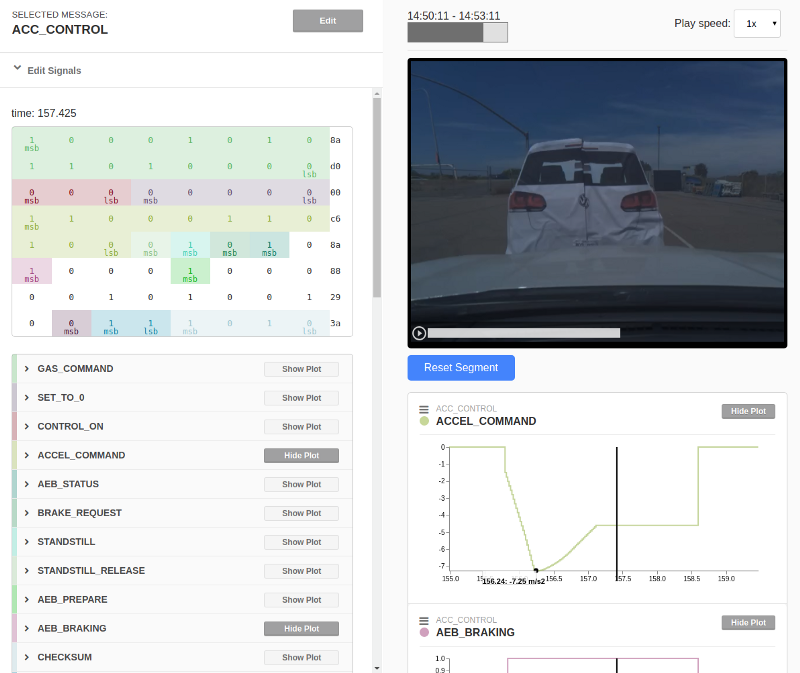
In order to be able to look for AEB events in our data set, we first had to reverse engineer the vehicle’s API over CAN. We built a fake vehicle target and we staged an imminent rear-end collision while driving our 2018 Honda Accord (Figure 4). We recorded the test using a comma EON.
We repeated the maneuver to collect several cases where the vehicle issued an automatic braking maneuver. We then used our open source CAN reverse engineer tool, Cabana, to find out which message and signals carry the AEB information.
Once we were able to tell which driving segments include an AEB event, we scanned our data set and found 308** **AEB occurrences. This is about one AEB event every 3,300 driven miles: not too rare!
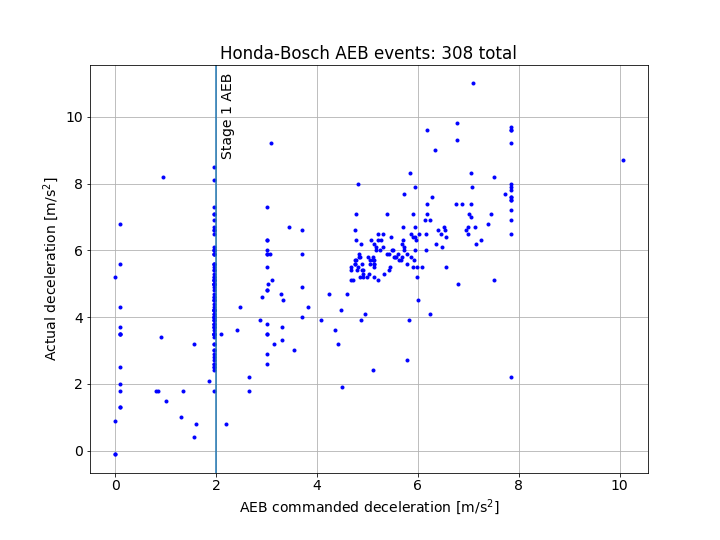
As it can be seen in Figure 6, there is quite a high number of AEB events with a commanded peak deceleration that does not exceed 2 m/s²: this probably represents some sort of “Stage 1” AEB state, where moderate automatic braking force is issued by the system to alert and/or assist the driver during the braking maneuver, before eventually escalating to a more severe AEB event. We were left with 194 AEB events after excluding what we defined as moderate “Stage 1” AEB events from our analysis.
True positives VS false positives
There are several ways to evaluate the performance of an AEB system. We propose the following 2 key performance indicators:
- Ratio between the number of true positive events (the system appropriately issues an AEB event) over the total amount of events where hard braking is necessary and an AEB event is required. Unfortunately, evaluating this metric without knowing the design scope of the feature is not very meaningful: we don’t know in which situation AEB is expected to trigger. We skip the evaluation of this performance indicator for the scope of this preliminary analysis.
- Number of false positive events (the system erroneously commands an AEB event) per driven mile. This is quite simple to assess, since we only need to focus on the 194 AEB events and classify which are false positives. A false positive AEB event is not only extremely annoying to the driver, but it can cause the car to be rear ended. Therefore, it’s important that false positive events are minimized. On the other hand, reducing false positives has the obvious risk of making AEB too conservative (a car without AEB has no false positives!). A quick way to discover false positive events is achieved by highlighting the cases where the driver did not hit the brake pedal at all during the deceleration event (Figure 7). Sometimes these correspond to cases where the driver was so distracted that he had to fully rely on AEB to slow down the vehicle, but this is unusual. Most of the time, AEB triggers in order to assist a driver who is already braking (perhaps not hard enough).
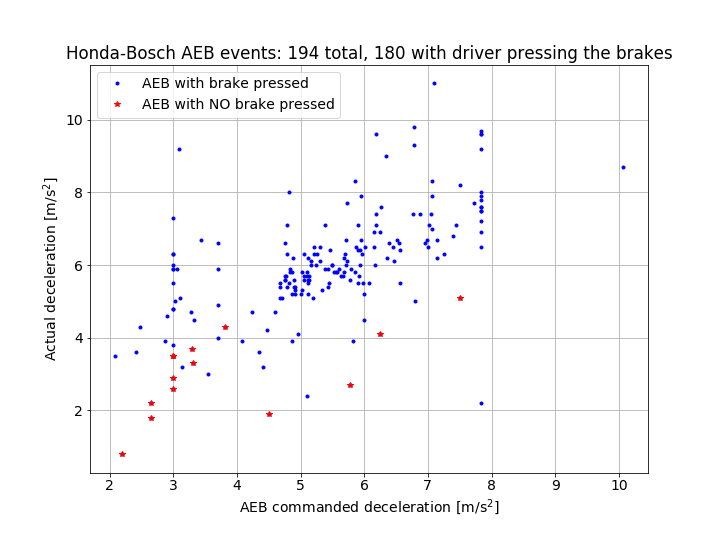
We manually scanned (i.e., running the replay and visually discern false positive from true positive AEB events) the entire set of 194 AEB events and found 10 false positives. This corresponds to** one false positive AEB event every 100,000 miles**, which seems acceptable. Some interesting AEB false positive events are illustrated below. Two false positive events are due to the system mistakenly braking for irrelevant objects on the road (see Figure 8,9).

Two other false positive events were caused by overhead metallic structures (see Figure 10,11).
The remaining six false positive events were all caused by the system unnecessarily braking for a turning lead vehicle, while the driver was trying to pass it (see two examples in Figure 12,13)
Conclusions
This post is an example on how we can use our large driving data set to find rare events and assess the real-world effectiveness of specific features, such as AEB. As the number of our users grows, so does the number of accumulated miles in our data set. How many miles do we need to be able to perform analyses on fleets of Honda vehicles better than Honda or Bosch themselves? It should not take long before we get there.
If you want to get involved:
- Follow us on Twitter and join our Discord. It’ll be fun!
- Get a comma device and contribute to openpilot.
- Apply to our open positions.
Leave a comment